Analytics work across HR, healthcare, and business.
A sample of my recent work. For additional projects or a custom discussion, contact me.
Employee Attrition Prediction (IBM Dataset)
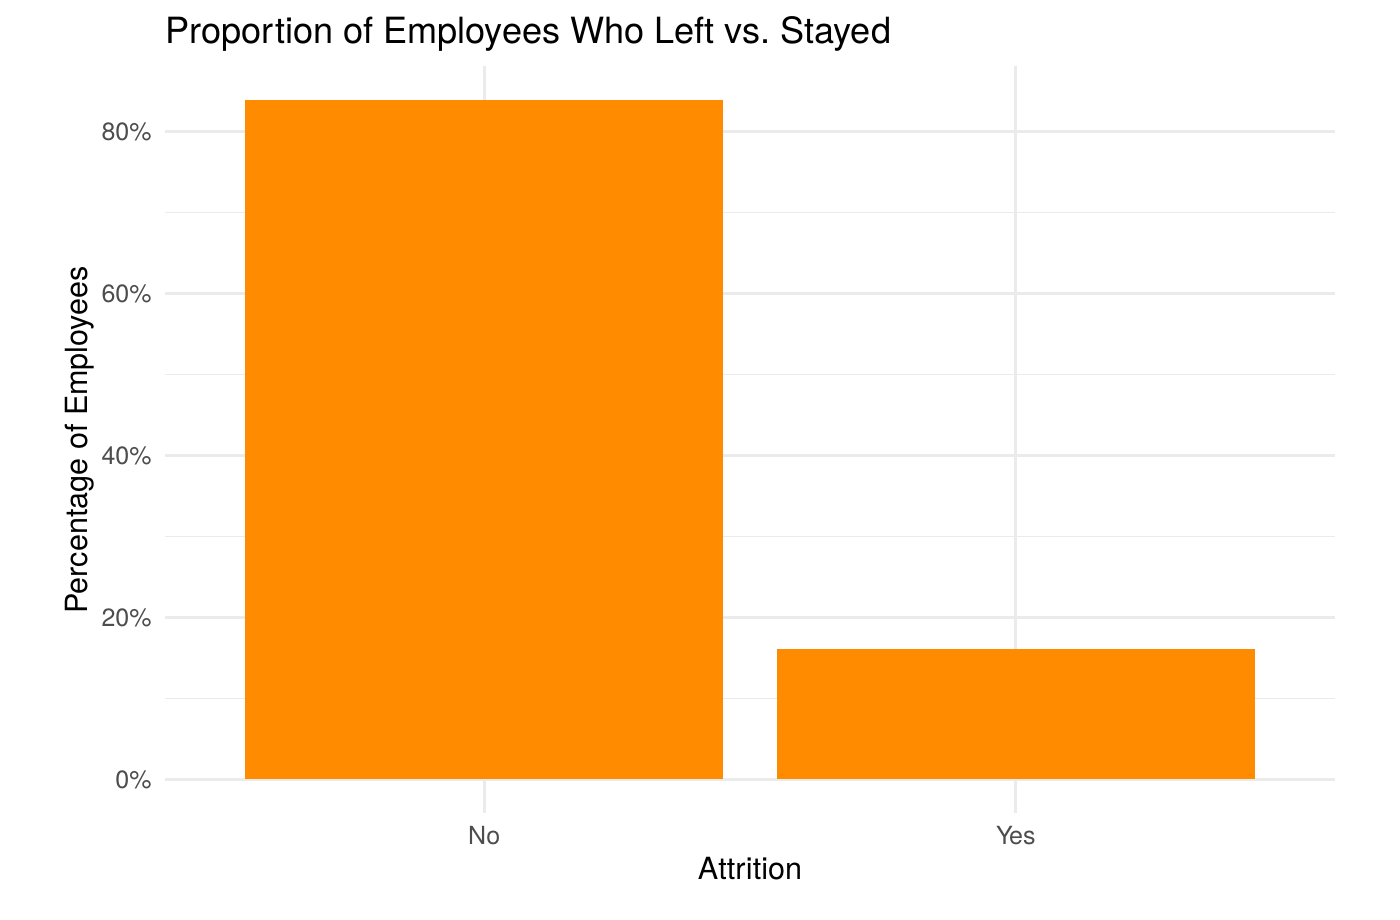
Compared seven modeling approaches - decision trees, logistic regression, SVM, Naive Bayes, Random Forest, and XGBoost - to predict attrition on the IBM HR Analytics dataset (1,470 employees), then translated model performance into an estimated dollar cost of missed at-risk employees.
Predicting Student Success
Built and evaluated five supervised machine learning algorithms on a 4,424-student UCI dataset to predict graduation outcomes, identifying financial standing and early academic momentum as the strongest signals - a model with applications well beyond higher education.
Workforce Turnover Analysis
Diagnostic turnover analysis using real HRIS data from a 2,568-employee organization spanning 1993-2022, tracing a 73.3% turnover spike in 2021 back to pay band - employees earning under $35,000 had by far the shortest tenure.
Predicting Employee Promotions & Awards
Built Logistic Regression, Random Forest, and K-Nearest Neighbors models on a 52,399-employee HR dataset to predict promotion and award outcomes, isolating average training score as the single strongest driver of advancement.
Life Flight of Maine - Chute Time Analysis
Analyzed five years of dispatch and weather data for a critical-care air medical transport organization to identify how crew composition, aircraft, and conditions affect "chute time" - the minutes between dispatch and airborne - and translated the findings into staffing and training recommendations.
Text Mining & NLP for Workforce Feedback
Built an end-to-end text-mining pipeline in R - corpus cleaning, stop-word removal, term-document frequency, and word-cloud visualization - demonstrating a technique directly transferable to mining exit interviews, engagement surveys, and other open-ended HR feedback at scale.
Predicting Heart Disease
Compared logistic regression against SVM models with linear and sigmoid kernels on a 300-patient clinical dataset to predict heart disease presence, with logistic regression surfacing chest pain type, ST depression, and coronary artery involvement as the clearest clinical red flags.
Mushroom Edibility Classification
Built decision tree models on an 8,124-specimen mushroom dataset to classify edible versus poisonous mushrooms from observable physical traits, isolating odor as the single strongest - and most field-usable - predictor, with the best model reaching 99.48% accuracy.
Data highlights
A closer look at each analysis above, pulled directly from the underlying reports.
Employee Attrition Prediction (IBM Dataset)
Model accuracy compared:
Model accuracy on held-out data. Notice that Random Forest (87.0%) barely beat the do-nothing baseline (84.0%) - with only 237 of 1,470 employees actually leaving, a model can score well just by leaning on the majority class. Accuracy alone doesn't tell you whether a model is actually catching at-risk employees.
Original Logistic Regression
Rebalanced (ROSE oversampling)
XGBoost, weighted loss
Rebalancing the training data traded 13 points of accuracy for nearly double the sensitivity - the model went from catching under half of employees who actually left to catching most of them. XGBoost's built-in class weighting reached a smaller version of the same trade-off without touching the training data at all.
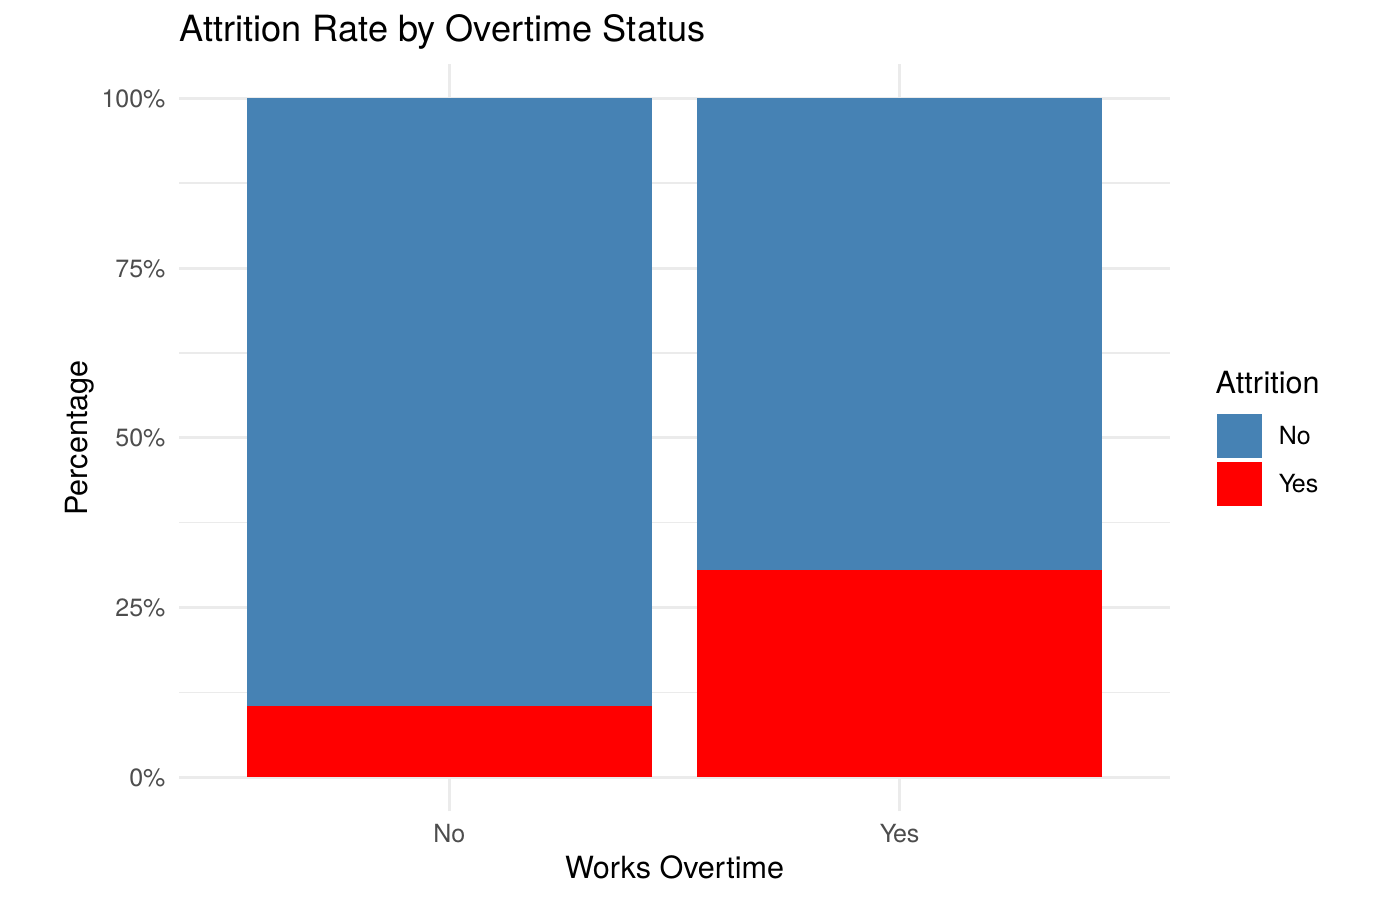
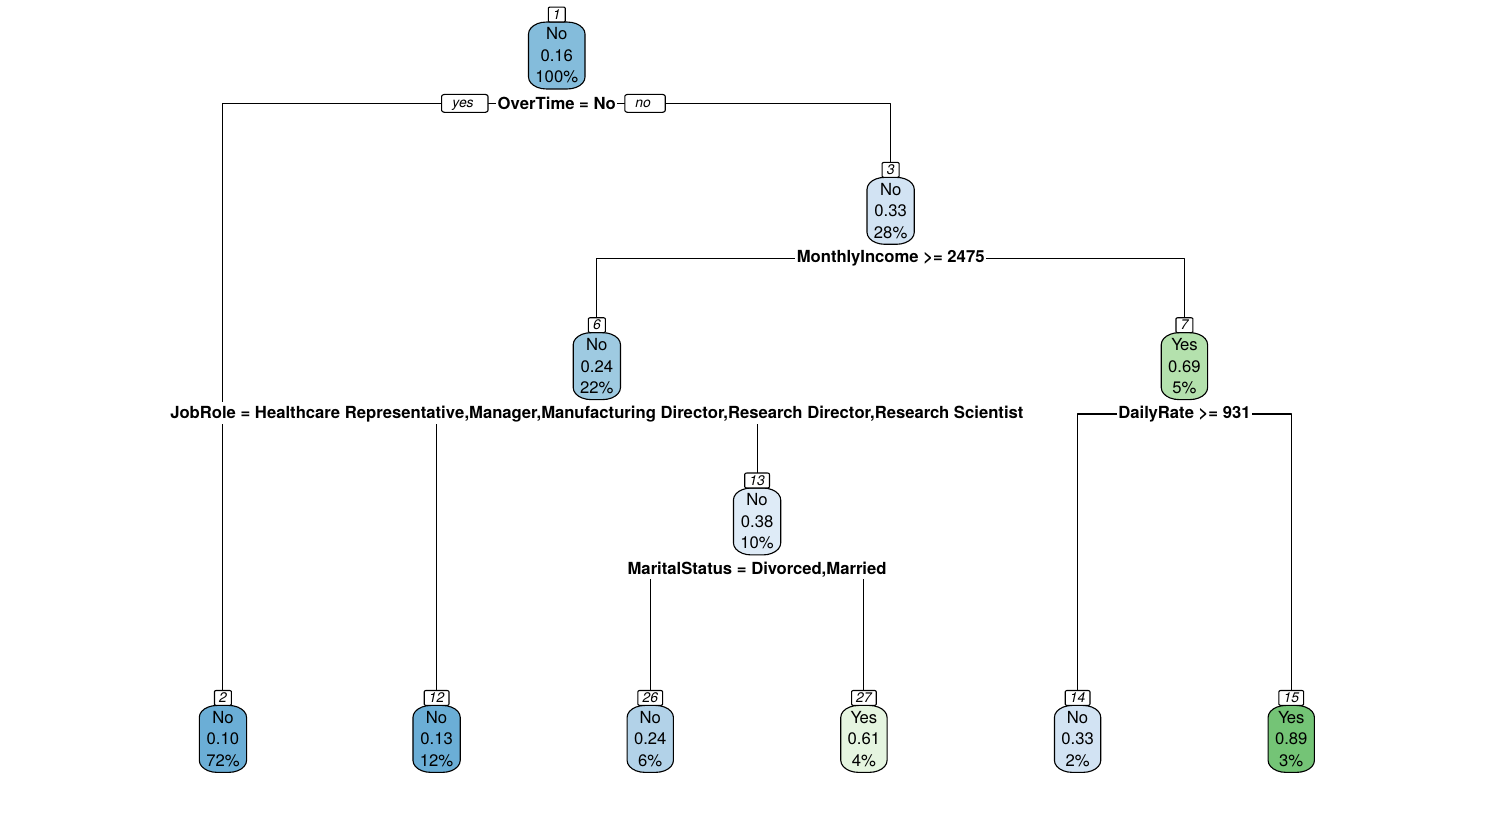
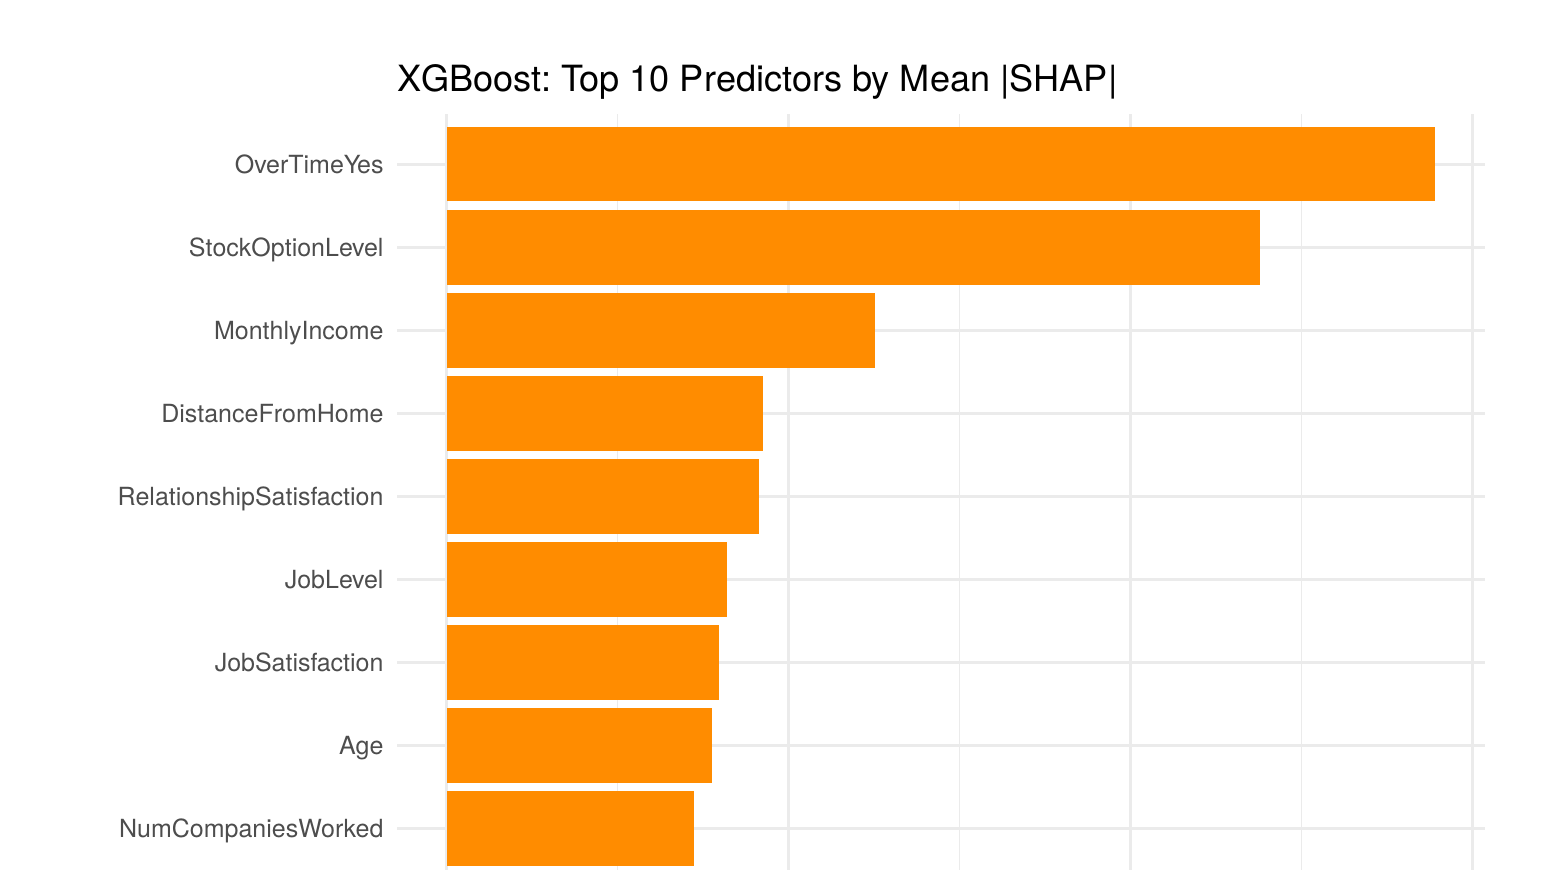
Employees who work overtime left at roughly 3× the rate of those who don't (31% vs. 10%), the single strongest individual signal in the dataset. The estimated dollar figures above are illustrative - based on a commonly cited 50%-of-salary replacement-cost benchmark, not this specific organization's real costs.
Strategic Recommendations
- Commission a workload and overtime audit for any team with chronic overtime - at 3× the attrition rate of the rest of the workforce, it's the single highest-leverage lever leadership can pull.
- Approve the rebalanced model for production use despite its lower headline accuracy - it catches 85% of departures instead of 47%, a trade-off Exco should weigh in dollars (≈$403K in additional exposure surfaced), not accuracy points alone.
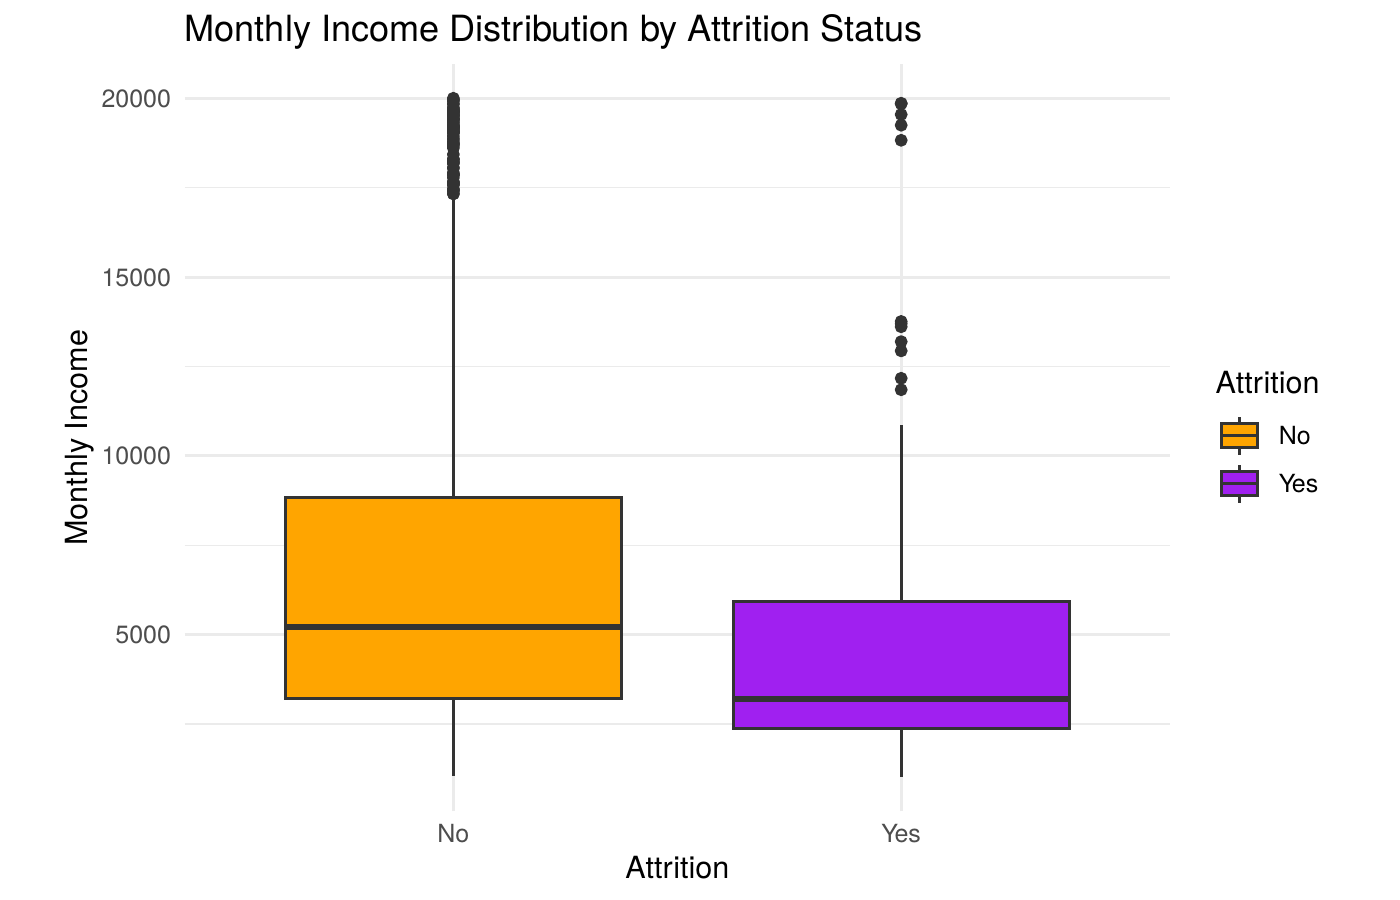
- Direct retention budget toward lower-income roles first, where both compensation and departure risk are most compressed, rather than spreading it evenly across the organization.
Predicting Employee Promotions & Awards
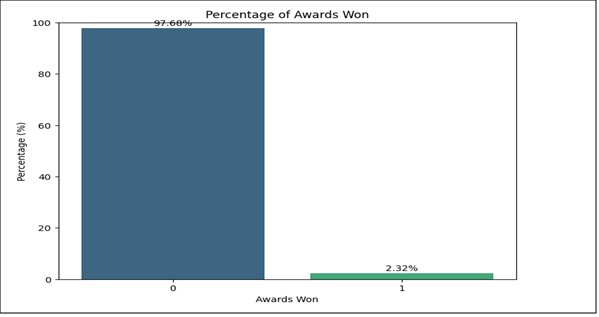
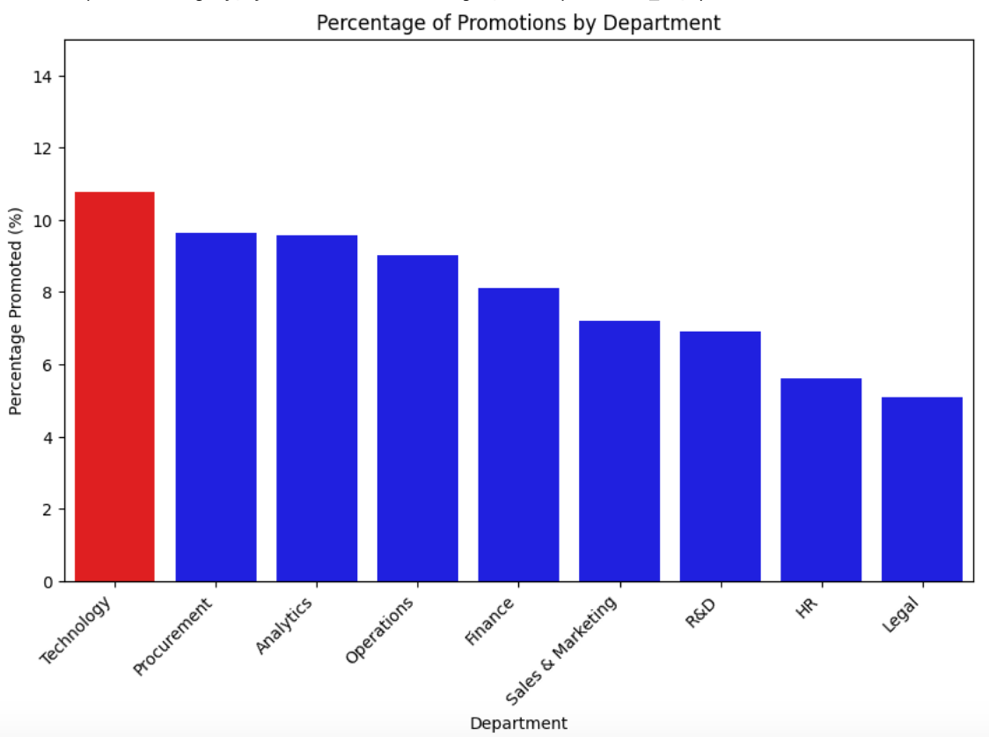
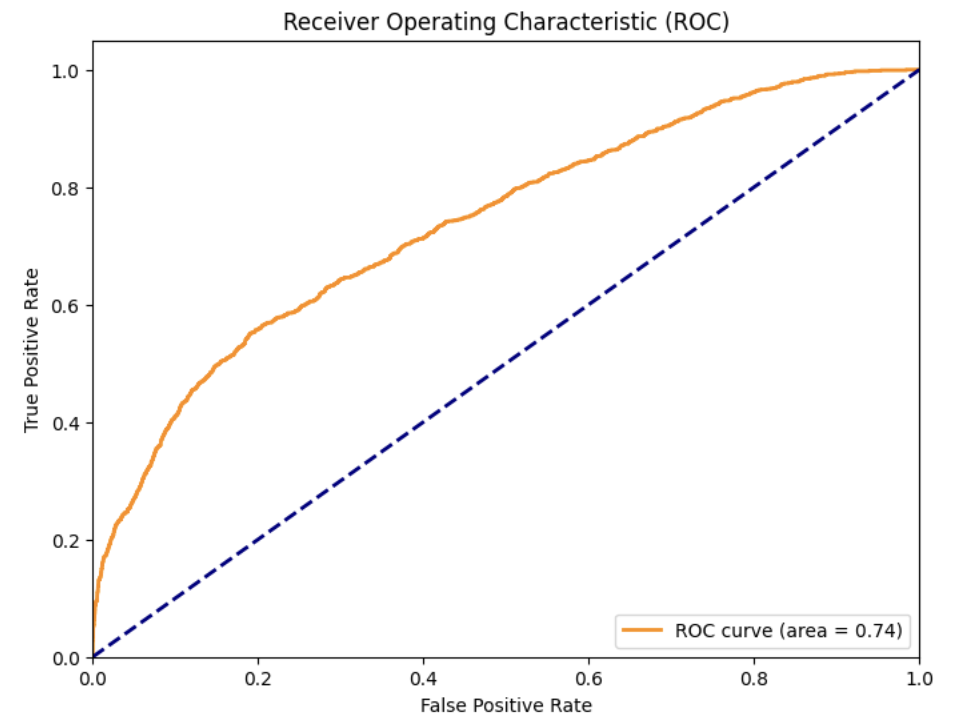
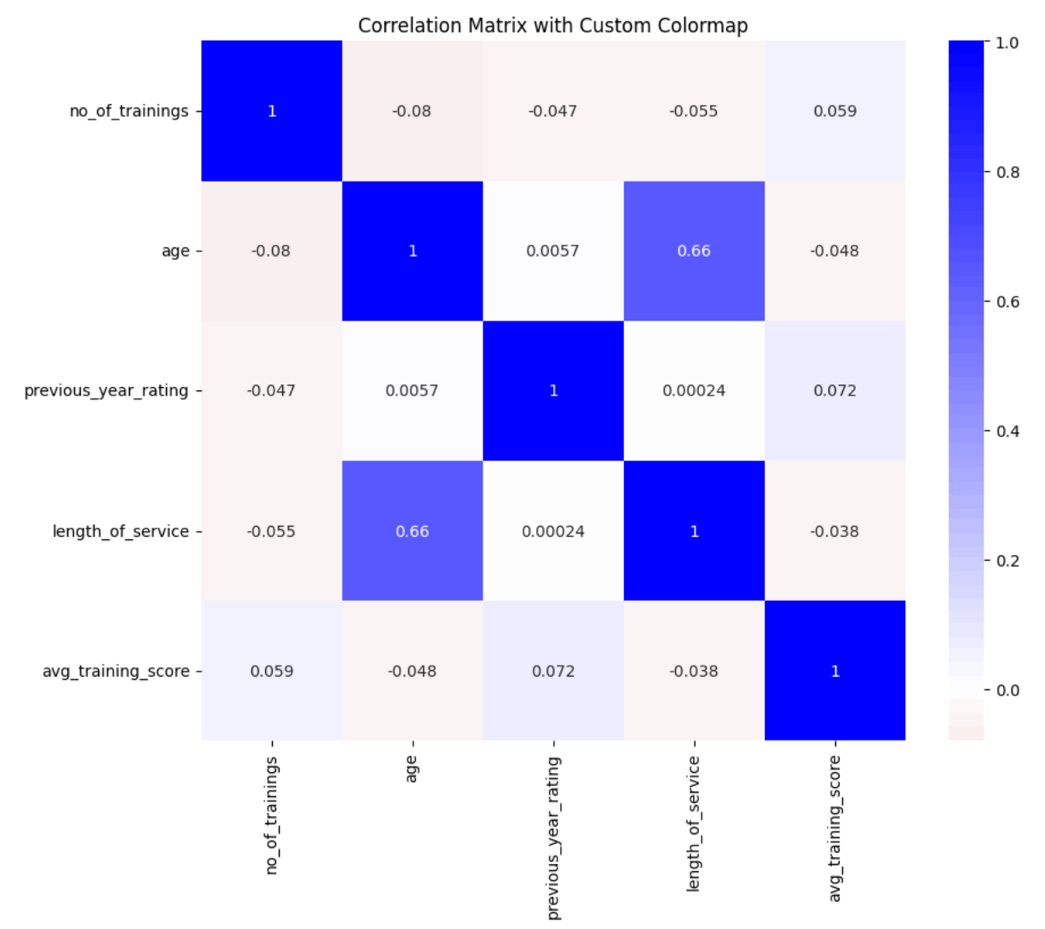
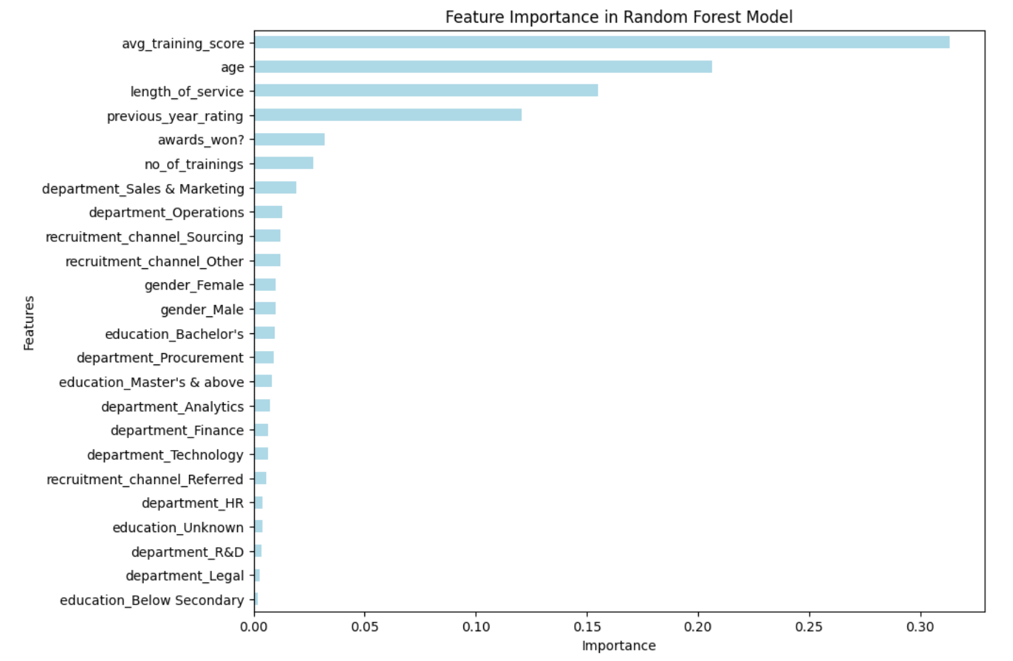
The unbalanced Logistic Regression model looked fine on paper but was functionally useless - it predicted "not promoted" almost every time and caught only 9% of employees who actually were. Random Forest handled the same imbalance far better on its own, reaching 93% accuracy. But award prediction told a harder story: with awards won by barely 2% of employees, K-Nearest Neighbors identified just 3 of 318 real award-winners, a reminder that some outcomes are too rare for a model to learn reliably without deliberately rebalancing the data first.
Strategic Recommendations
- Review whether training score should carry this much weight in promotion outcomes - Exco should confirm this reflects deliberate policy, not an unexamined bottleneck that sidelines otherwise strong performers.
- Invest in a structured recognition program - with only 2.3% of employees ever receiving an award, recognition is a badly under-used lever for engagement and retention relative to its potential impact.
- Standardize promotion practices across departments; Technology promotes at roughly double the rate of Legal, a gap worth an equity and consistency review before it becomes a retention or morale issue.
Predicting Student Success
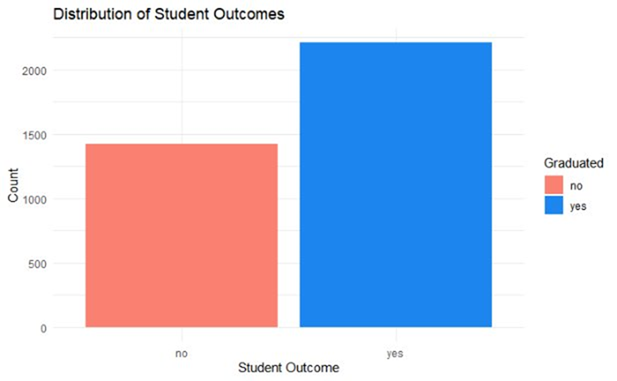
Model accuracy compared:
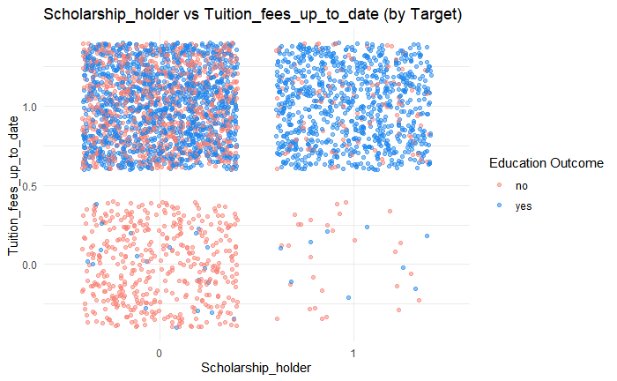
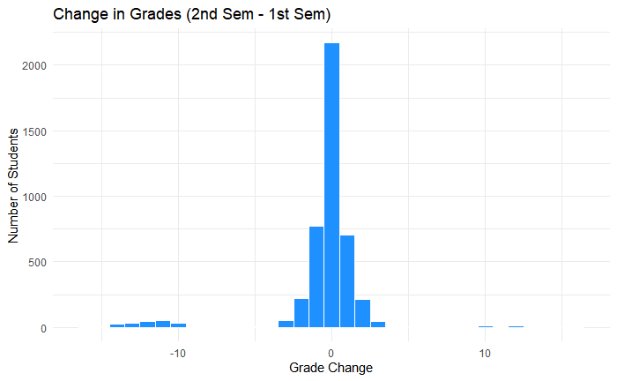
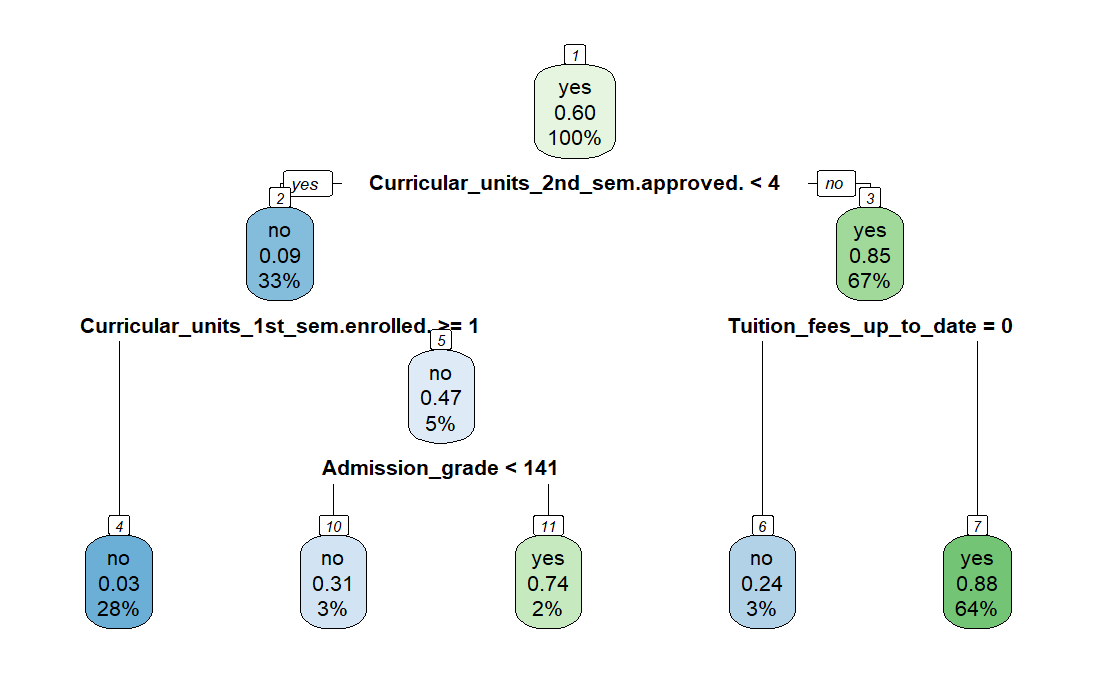
SVM with a linear kernel edged out every other model, including a Random Forest that badly underperformed here - a reminder that more complex models don't always win. Tuition payment status and second-semester units approved were the strongest predictors of graduation, pointing to financial standing and early academic momentum as the two biggest levers for student retention efforts.
The methodology here isn't specific to higher education - it's a general template for early-warning retention modeling. In HR, the same approach flags which new hires are at risk of leaving before their first review, using early engagement and performance signals the way this model uses first-semester grades and units approved. For an NGO or membership organization, the same logic applies to donor or beneficiary attrition: identifying who's disengaging early enough to intervene, rather than finding out only when they're already gone.
Strategic Recommendations
- Stand up an early-warning intervention trigger keyed to first-period performance and engagement signals - whether first-semester grades, a new hire's first 90 days, or a donor's first engagement window - rather than waiting for a formal review cycle to catch at-risk individuals.
- Treat financial standing as a retention lever, not just an outcome; scholarship and tuition-flexibility policies moved the needle here, suggesting HR and NGO leadership should examine financial-support programs as retention tools in their own right.
- Favor simpler, well-tuned models over complexity for its own sake - SVM's linear kernel beat Random Forest here, a reminder worth carrying into any Exco model-selection decision.
Workforce Turnover Analysis
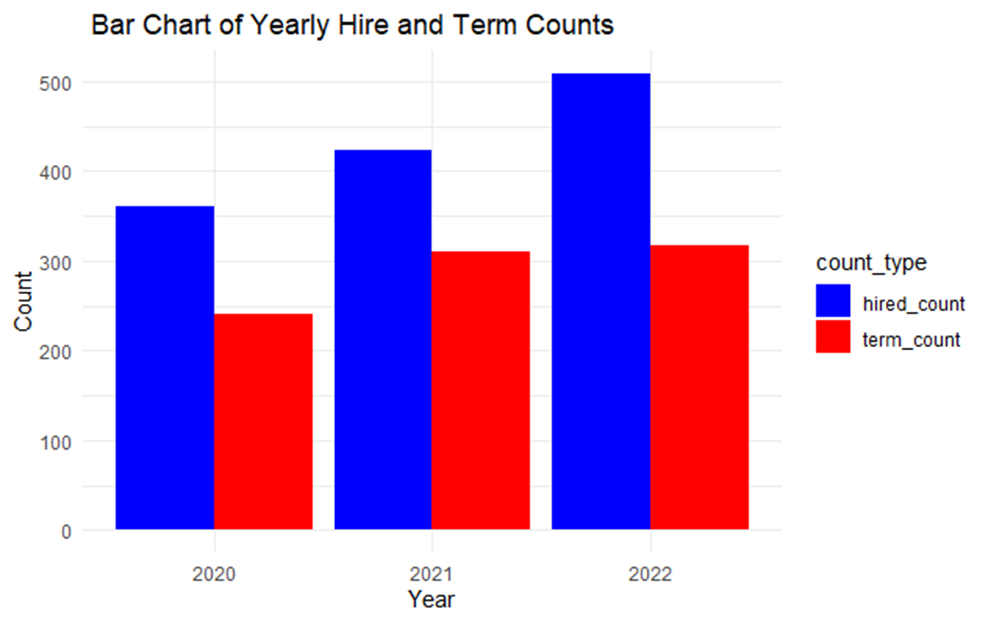
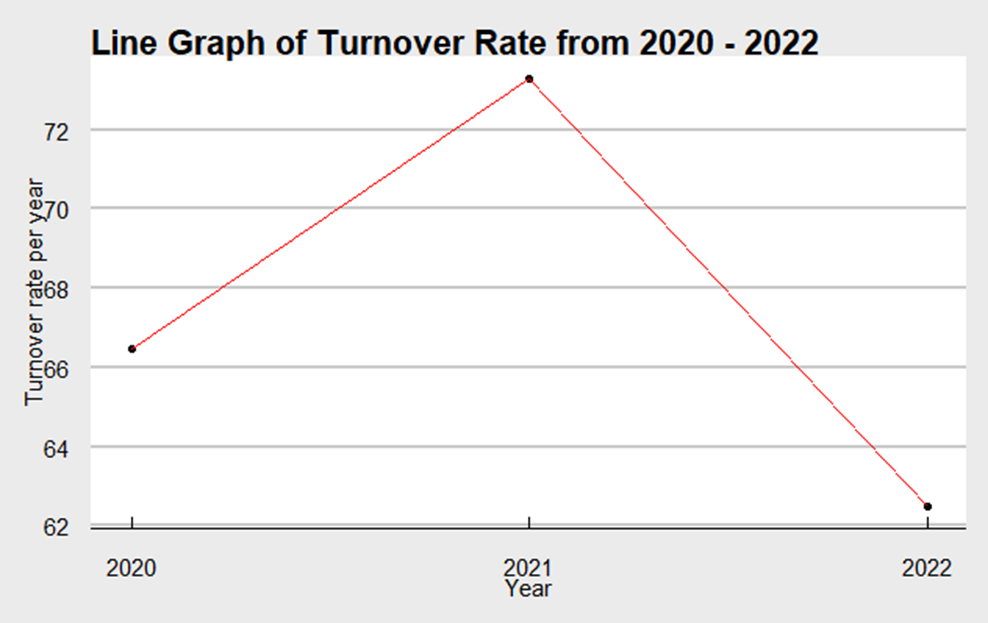
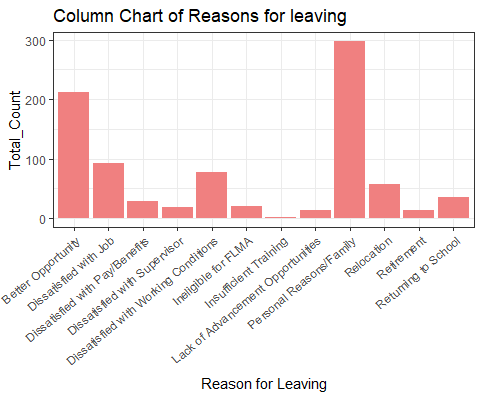
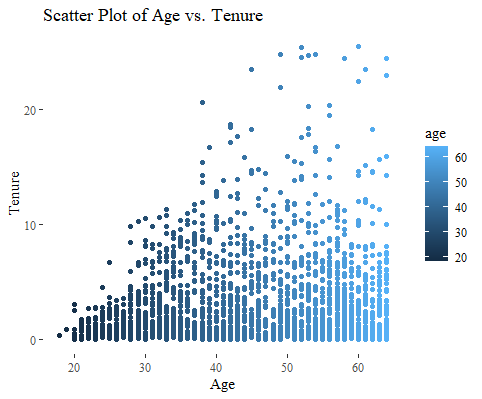
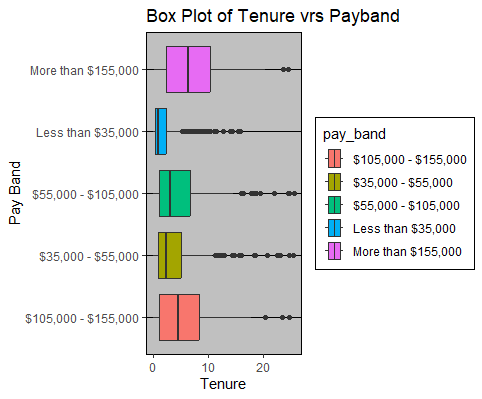
Part-time employees left earlier than full-time employees overall, and among full-time staff with short tenure, the majority were female - a pattern worth a closer look alongside the compensation data above.
Strategic Recommendations
- Redesign the compensation floor below $35,000 - this band drove the shortest tenure by a wide margin and is the clearest, most actionable lever identified in the data.
- Run stay interviews targeting "personal/family" exits to determine whether flexible work arrangements could convert some of this currently-uncontrollable attrition into retainable attrition.
- Benchmark market pay immediately following any turnover spike - "better opportunity" exits are controllable, and the 2021 spike is a concrete case study for how quickly compensation drift can turn into a retention crisis.
Life Flight of Maine - Chute Time Analysis
For a critical-care air medical transport operation, "chute time" - the minutes between a 911 dispatch and the aircraft leaving the ground - is one of the few variables an organization can actually influence, and every minute shaved off it is a minute closer to definitive care. This project analyzed five years of dispatch and weather data across Life Flight of Maine's fleet and crews to find out what actually moves that number, and who's doing it fastest.
Share of missions flown by aircraft:
LF1 and LF2 carried the bulk of the workload, together flying more than three-quarters of all missions between 2019 and 2023. LF1's heavier use cut both ways: it also swung between the fleet's shortest and longest chute times, suggesting that volume alone doesn't guarantee consistency - crew and conditions matter just as much as the aircraft.
Fastest pilots
Fastest medics
Fastest nurses
Average chute time in minutes from dispatch to airborne - lower is faster. Conditions mattered as much as crew: chute times ran roughly 2 minutes longer at night, and climbed further in colder, lower-visibility weather, a reminder that the hardest missions to fly fast are often the ones where speed matters most. Based on consistently faster times across conditions, the team recommended the crew members above as internal trainers - turning the analysis into a concrete, actionable staffing recommendation rather than just a finding.
Strategic Recommendations
- Formalize the fastest crew members as internal trainers with dedicated time and budget - the analysis already identifies exactly who, turning a finding into a ready-to-approve staffing decision.
- Build night and adverse-weather staffing protocols that account for the ~2-minute average time penalty, since the hardest conditions to fly fast in are also the missions where speed matters most.
- Review fleet rotation and maintenance scheduling for LF1, whose heavy utilization and inconsistent chute times together suggest volume alone isn't producing reliable performance.
Text Mining & NLP for Workforce Feedback
Most of the richest signal in an organization - exit interview notes, open-ended engagement survey responses, candidate feedback - sits in free text that never gets systematically read, let alone analyzed. This project built the full pipeline for turning that kind of unstructured text into a quantified, visual summary: cleaning and normalizing a corpus, stripping noise and stop words, building a term-document frequency matrix, and surfacing the dominant terms as both a ranked chart and a word cloud. The practice corpus here is a classic literary text, chosen to stress-test the pipeline on dense, unfamiliar language - but the technique transfers directly to any body of open-ended HR text.
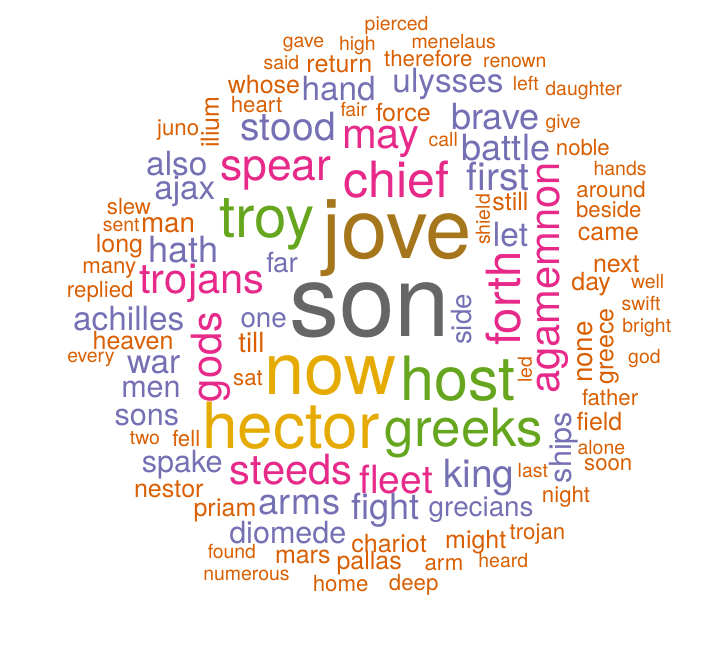
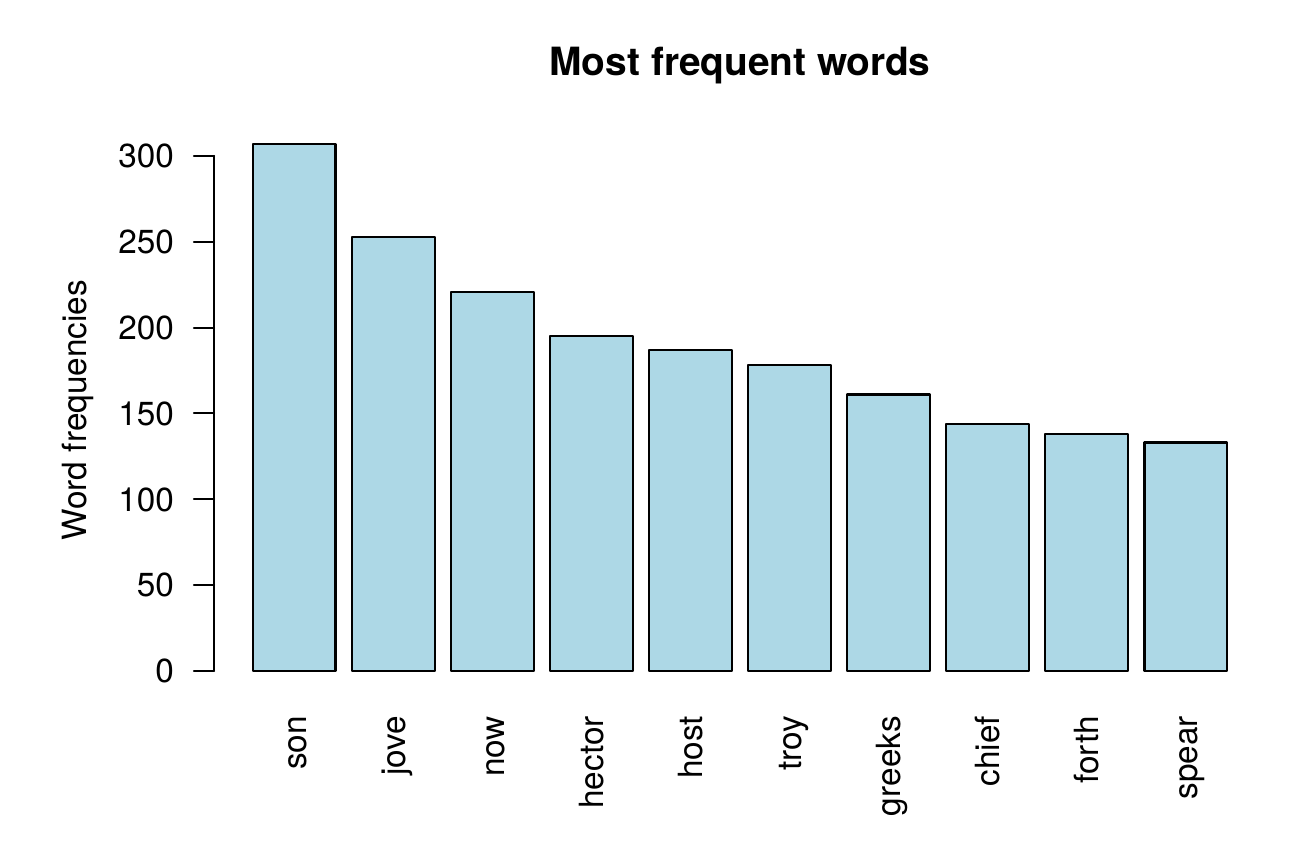
The pipeline - lowercase conversion, punctuation and number stripping, custom and standard stop-word removal, then term-document frequency counting - is the same sequence used to mine open-ended HR text at scale. Run against exit-interview comments, it surfaces recurring complaint themes without a human reading every response line by line. Run against engagement-survey free text, it turns hundreds of open comments into a handful of dominant, trackable themes in minutes instead of days - the kind of leverage that turns unstructured feedback from an ignored data source into a regular input for leadership decisions.
Strategic Recommendations
- Pilot this pipeline on exit-interview and engagement-survey free text this quarter - it requires no new data collection, only applying this existing method to text HR already holds.
- Stand up a recurring quarterly term-frequency report for leadership - turning open-ended feedback into a tracked input for Exco meetings rather than an archive no one revisits.
- Pair term frequency with sentiment scoring before presenting findings - frequency shows what people are talking about, sentiment shows how they feel about it; together they're a far stronger basis for action than either alone.
Predicting Heart Disease
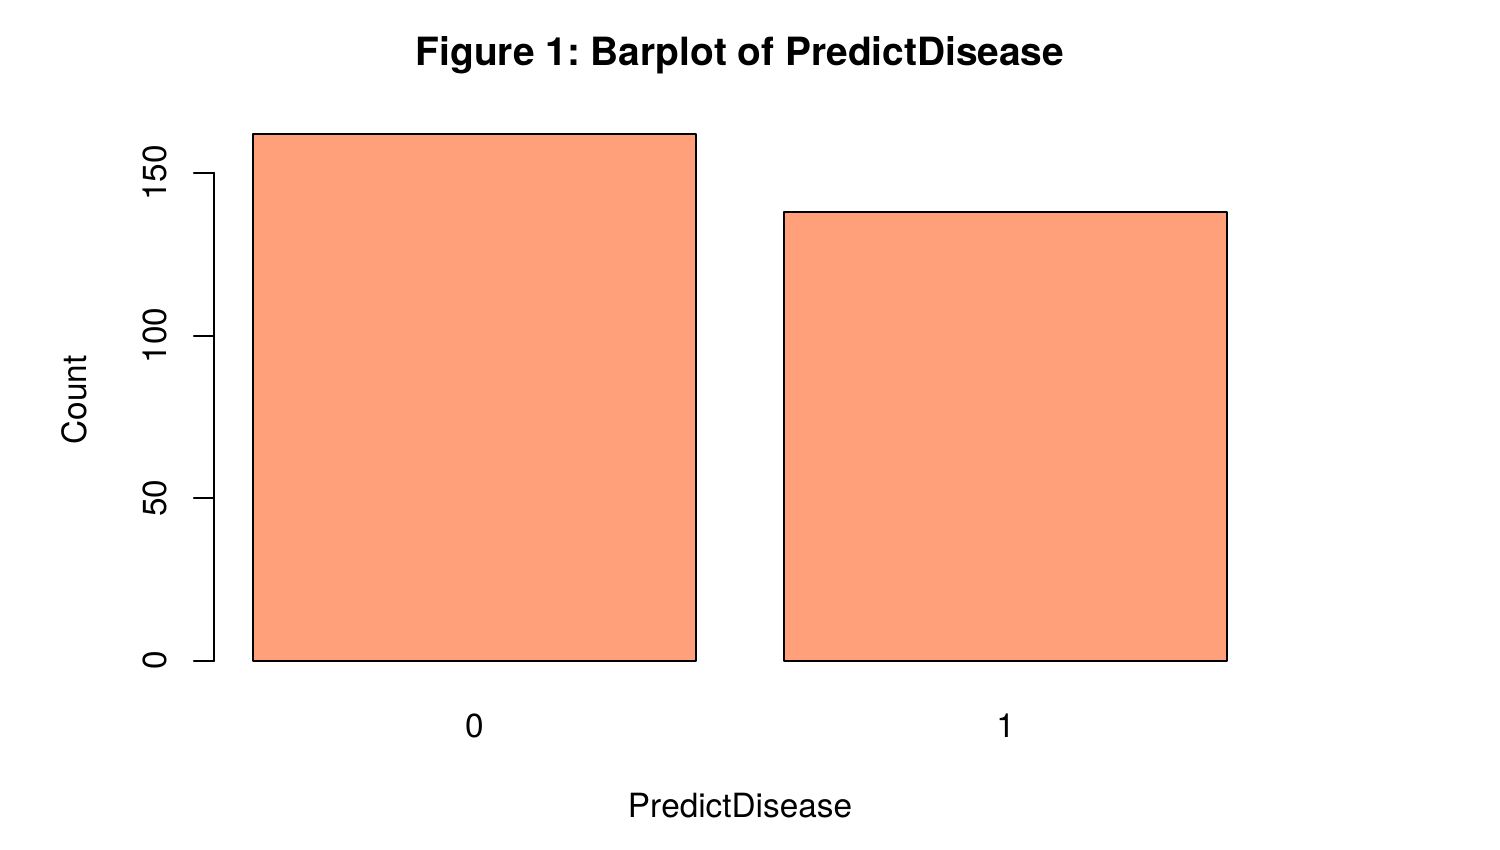
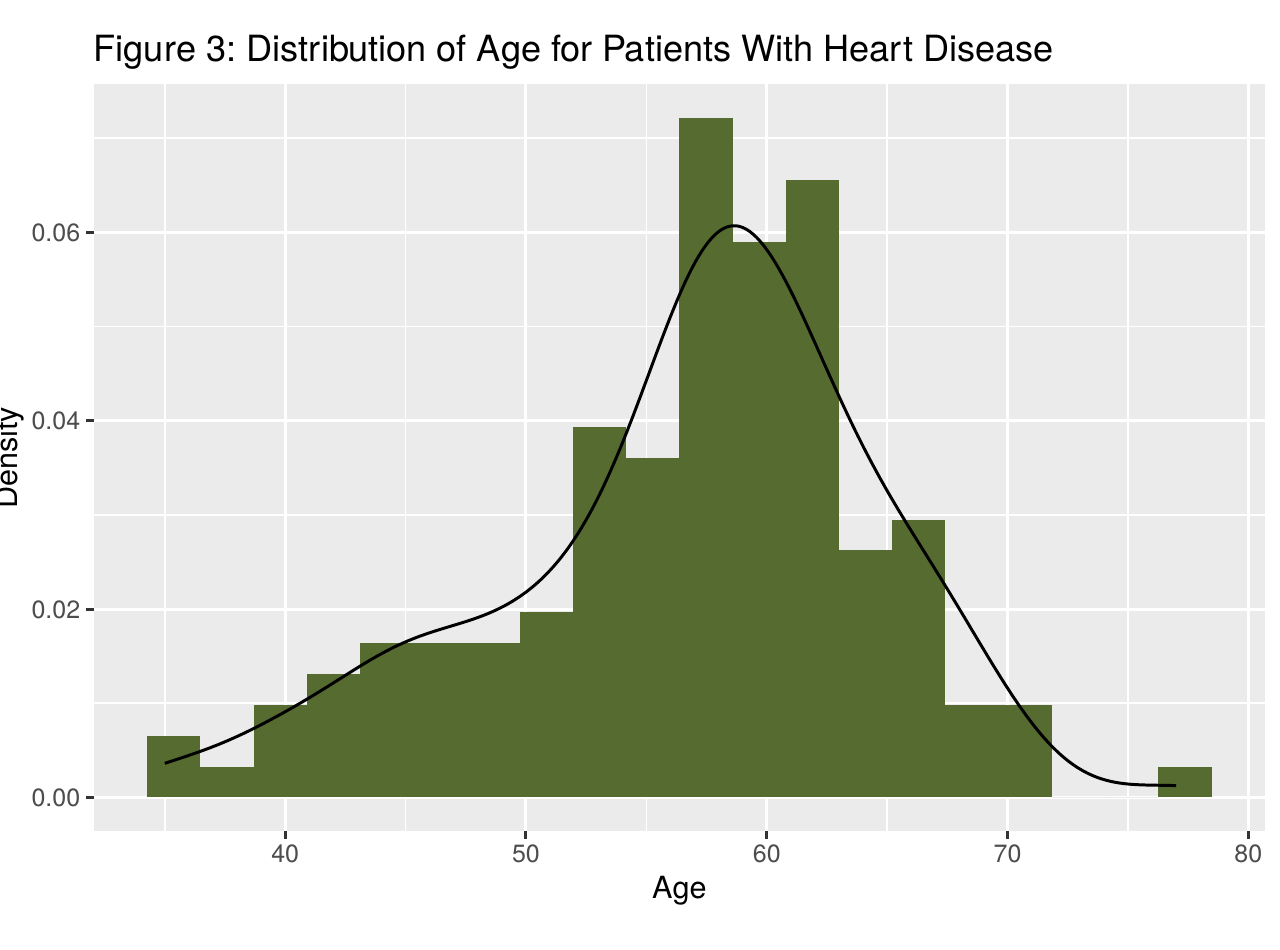
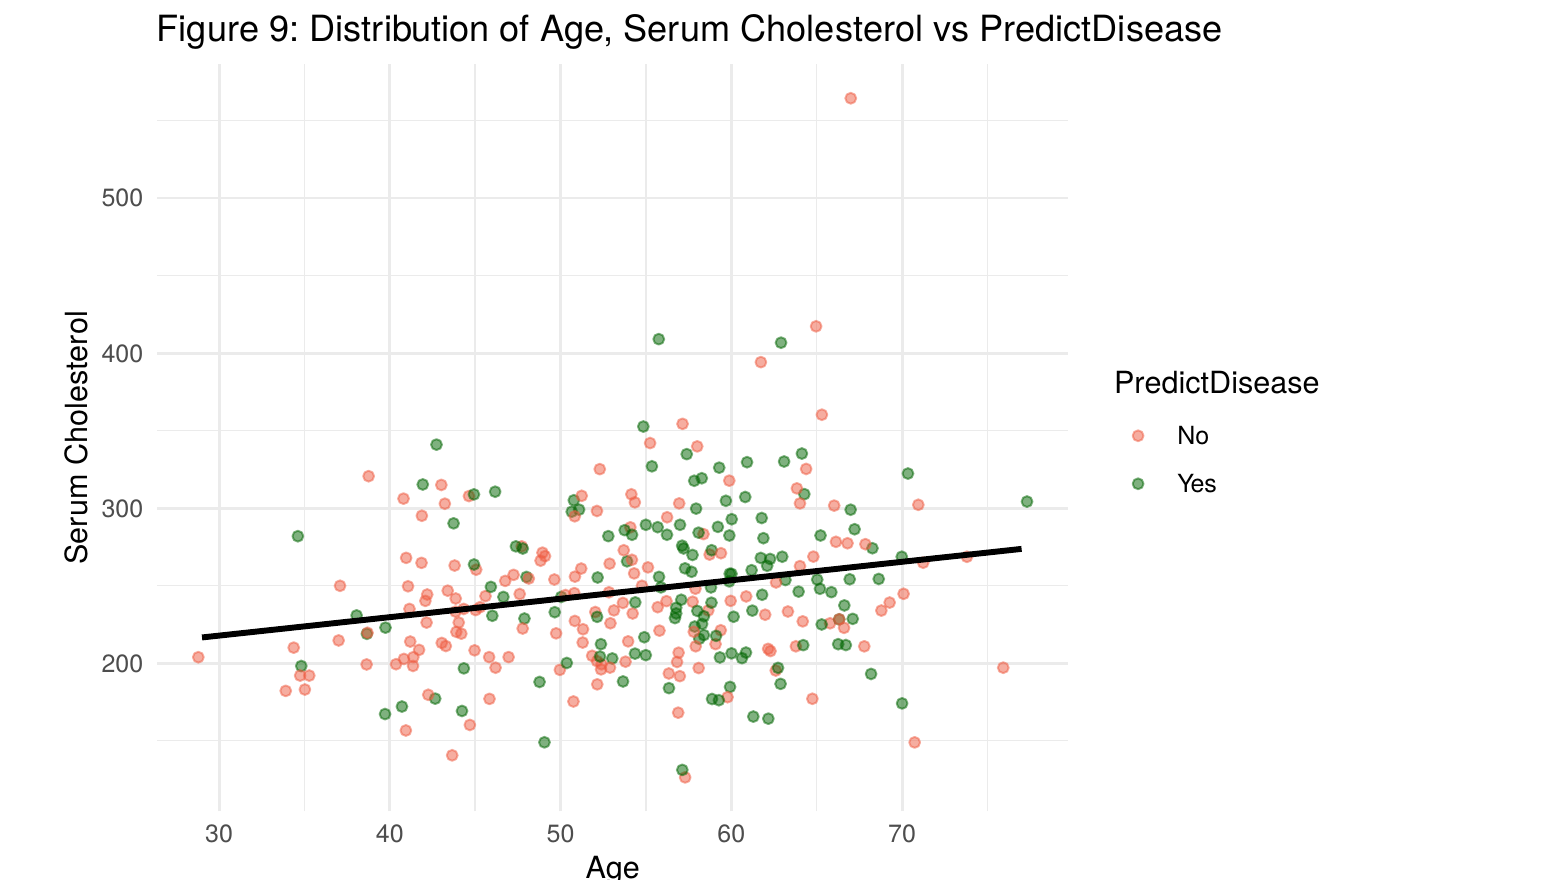
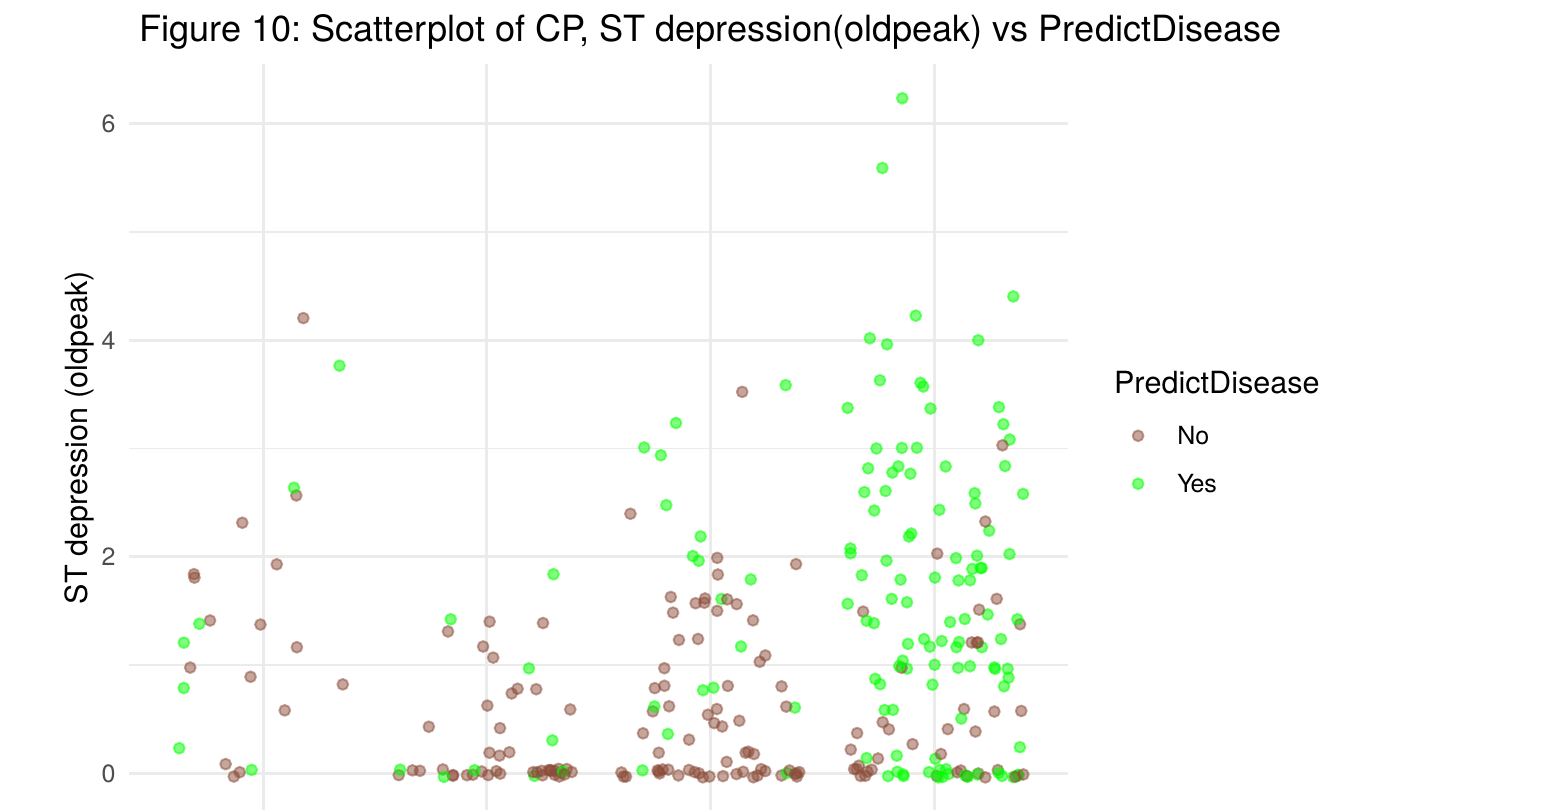
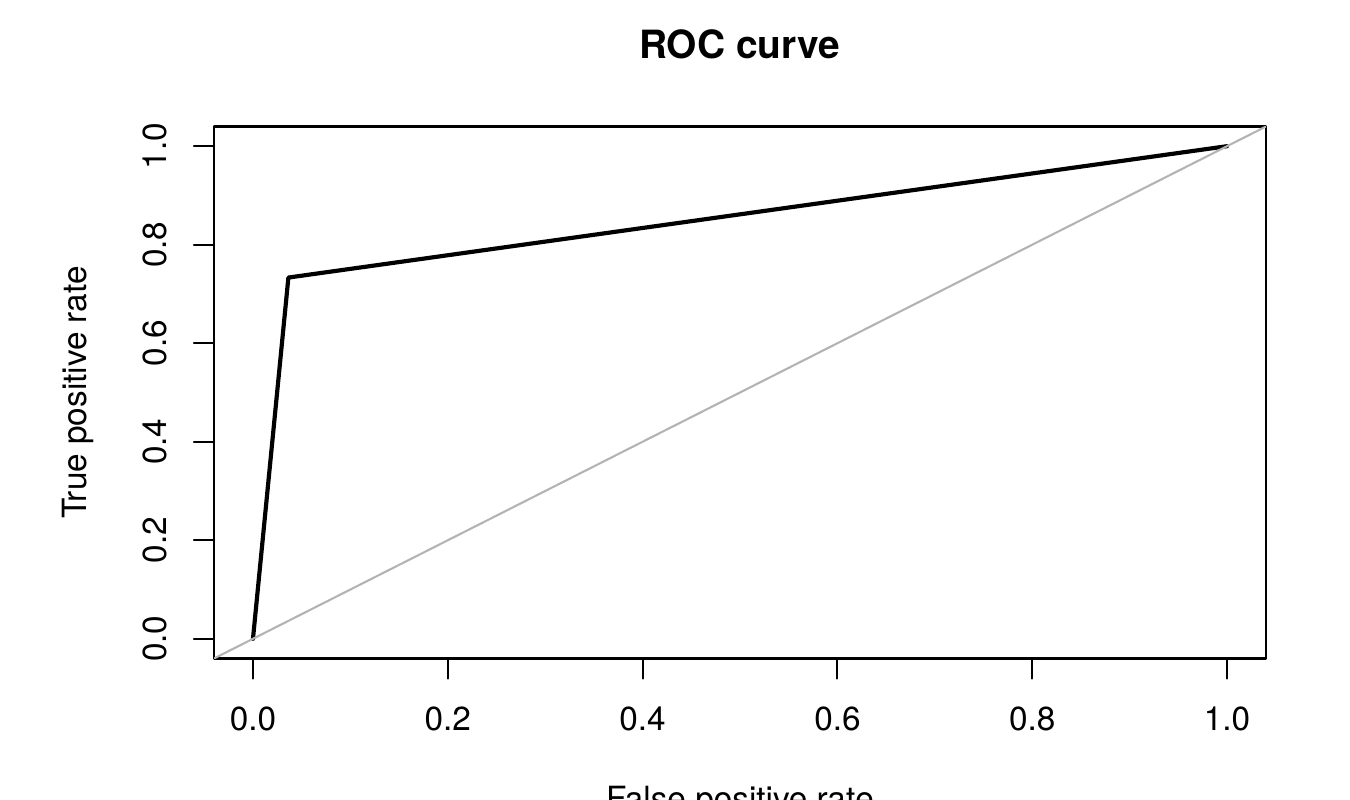
All three models performed respectably - AUCs ranged from 0.79 to 0.85 - but logistic regression won on every metric that mattered: highest accuracy (86%), highest specificity (94.3%), and the clearest interpretability. Rather than a black box, it named its reasoning: being male, chest pain types 2 and 4, elevated ST depression, and especially the number of major vessels colored by fluoroscopy (ca) came back as statistically significant predictors, with ca the single strongest (p < 0.0001). For a clinical screening context, a model that both performs well and tells you why is worth more than a marginal accuracy gain from a less transparent one.
Strategic Recommendations
- Adopt logistic regression as the screening-support model, not the highest-AUC option - its transparent coefficients let clinical leadership audit and defend every flagged case, a governance requirement SVM's black-box boundary can't meet.
- Add structured capture of chest pain type and ST depression to intake - the two strongest, cheapest-to-collect clinical flags - so the model has its best inputs from the first visit rather than retrofitted later.
- Prioritize proactive screening outreach for older male patients, the demographic where risk concentrates most heavily in this cohort, as the highest-yield use of limited screening capacity.
Mushroom Edibility Classification
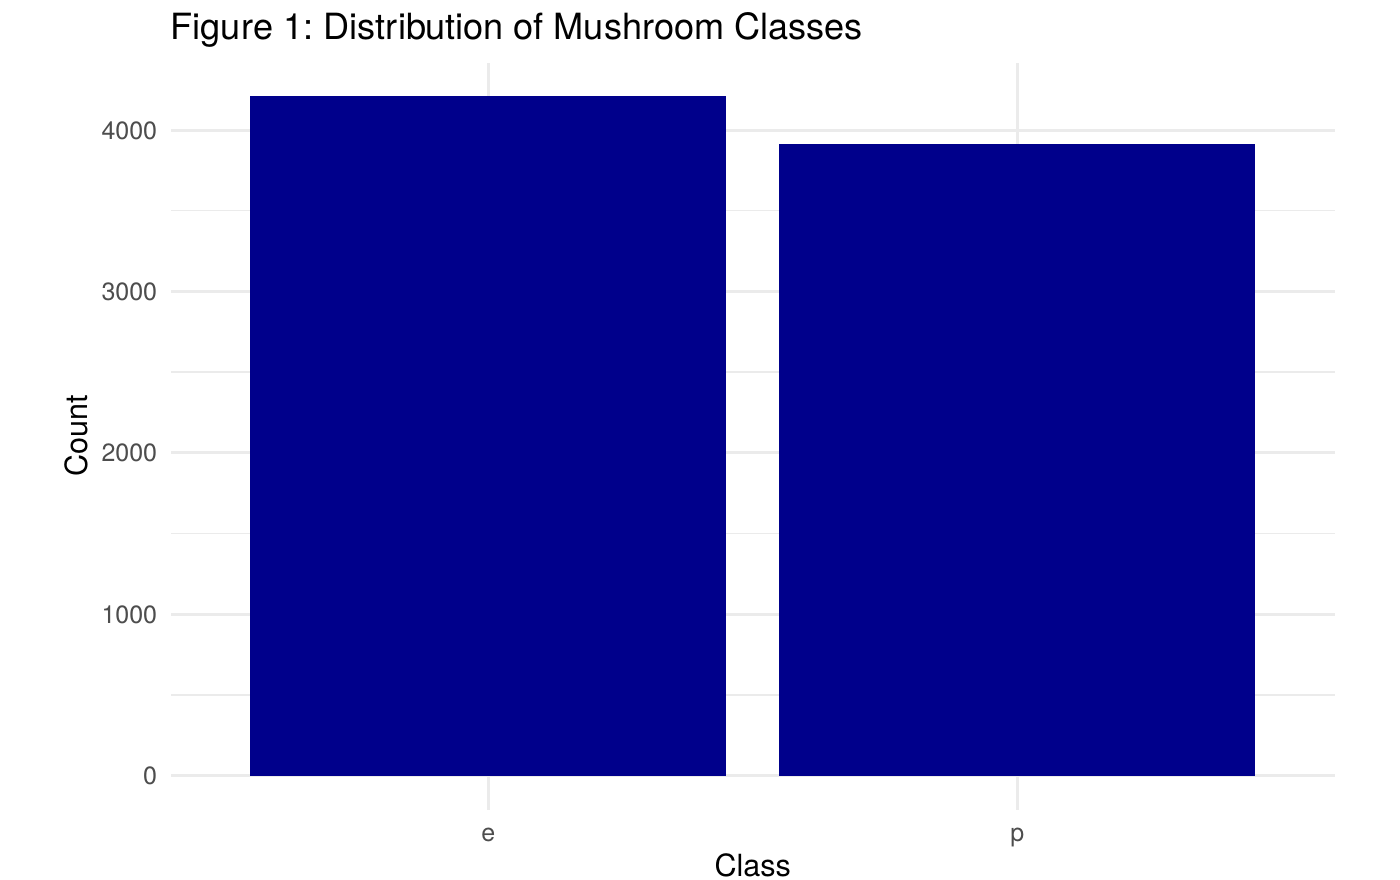
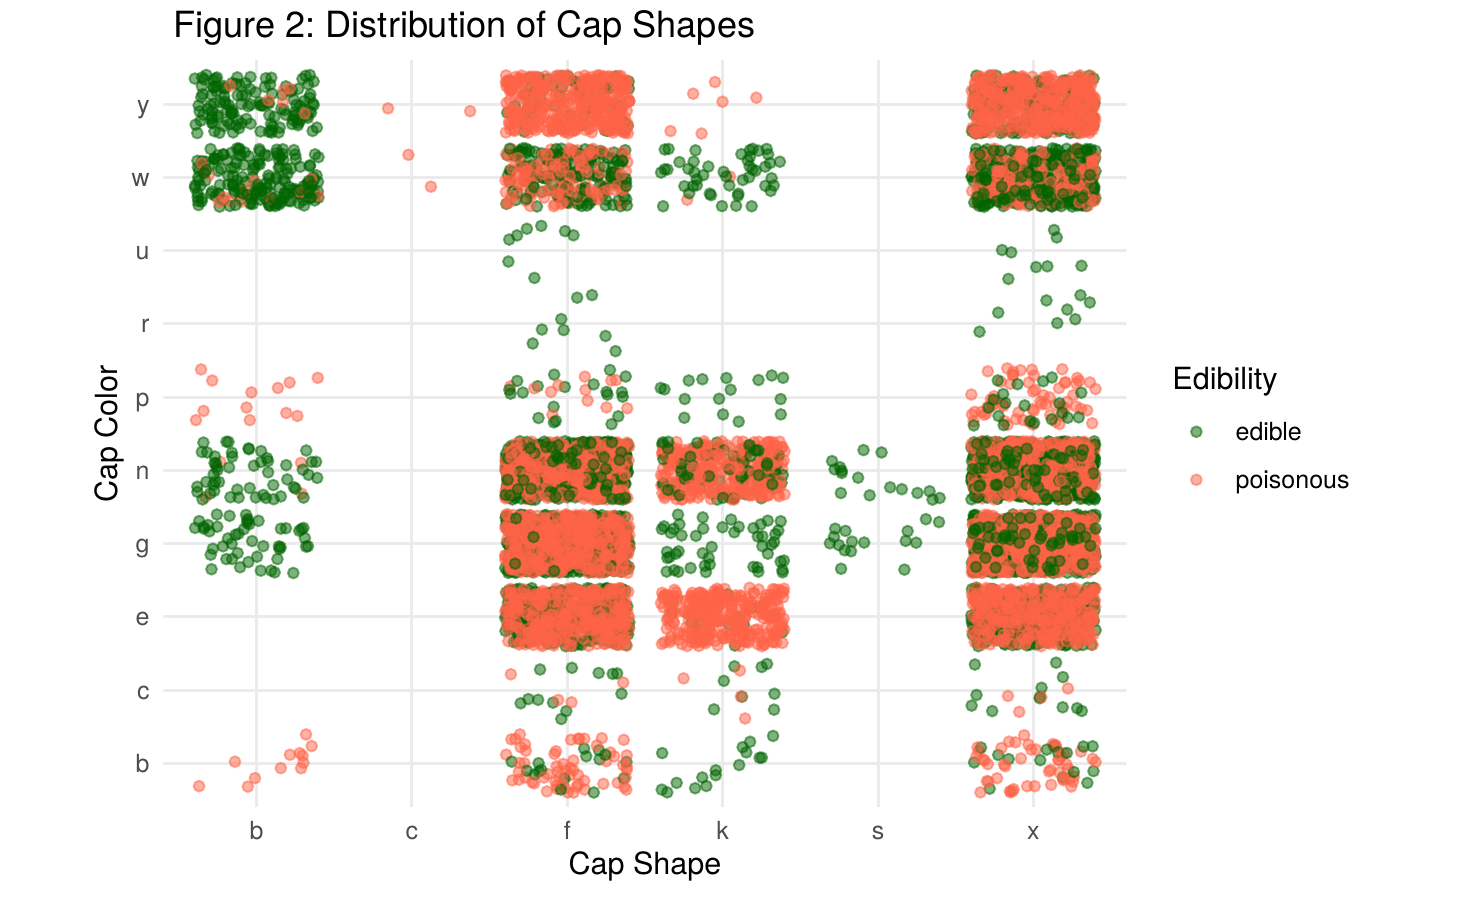
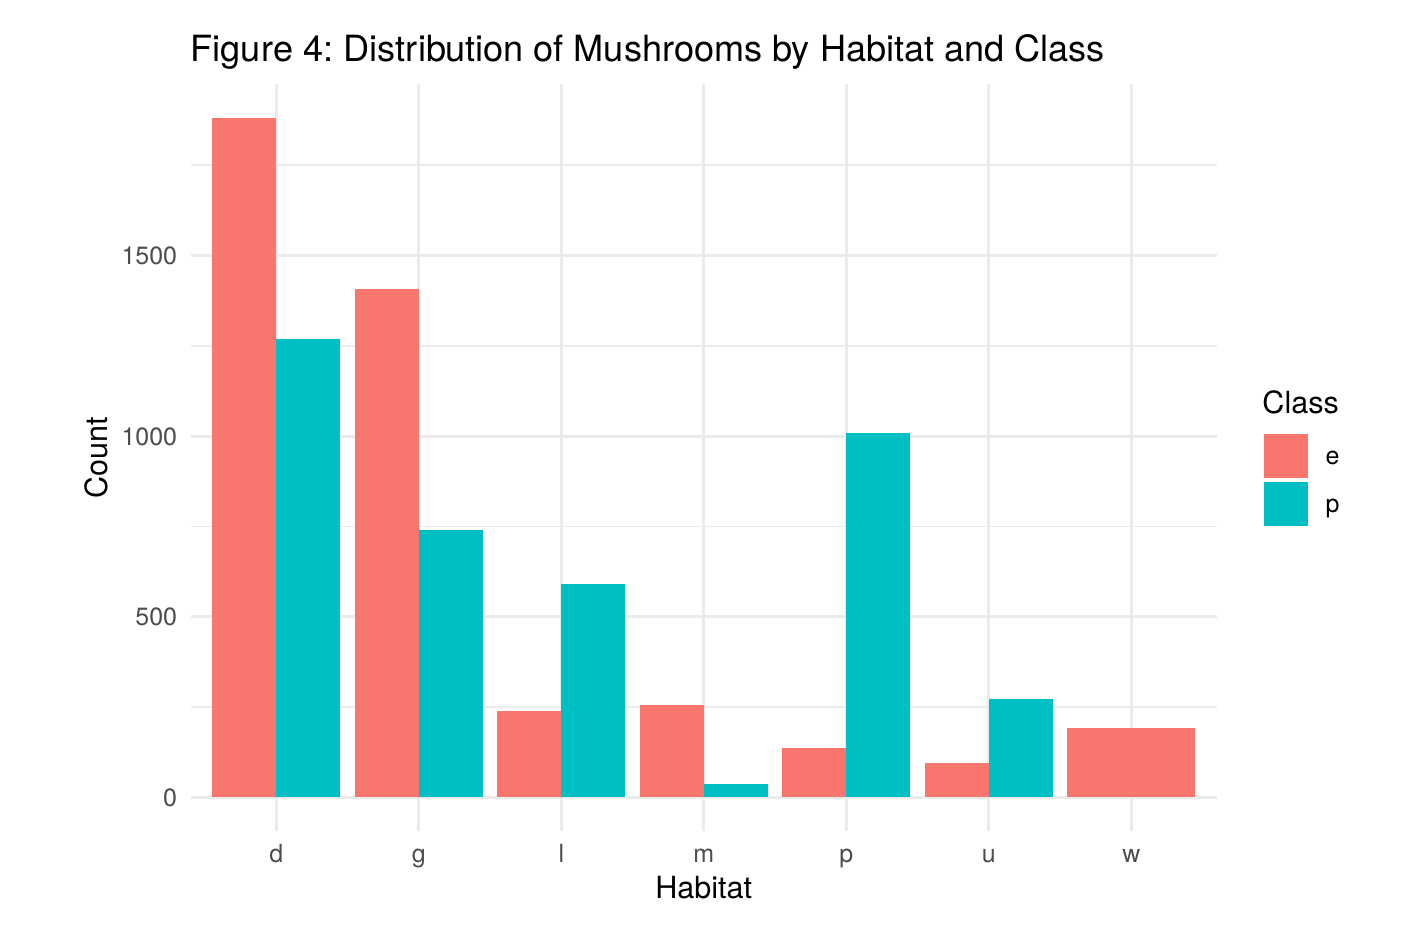
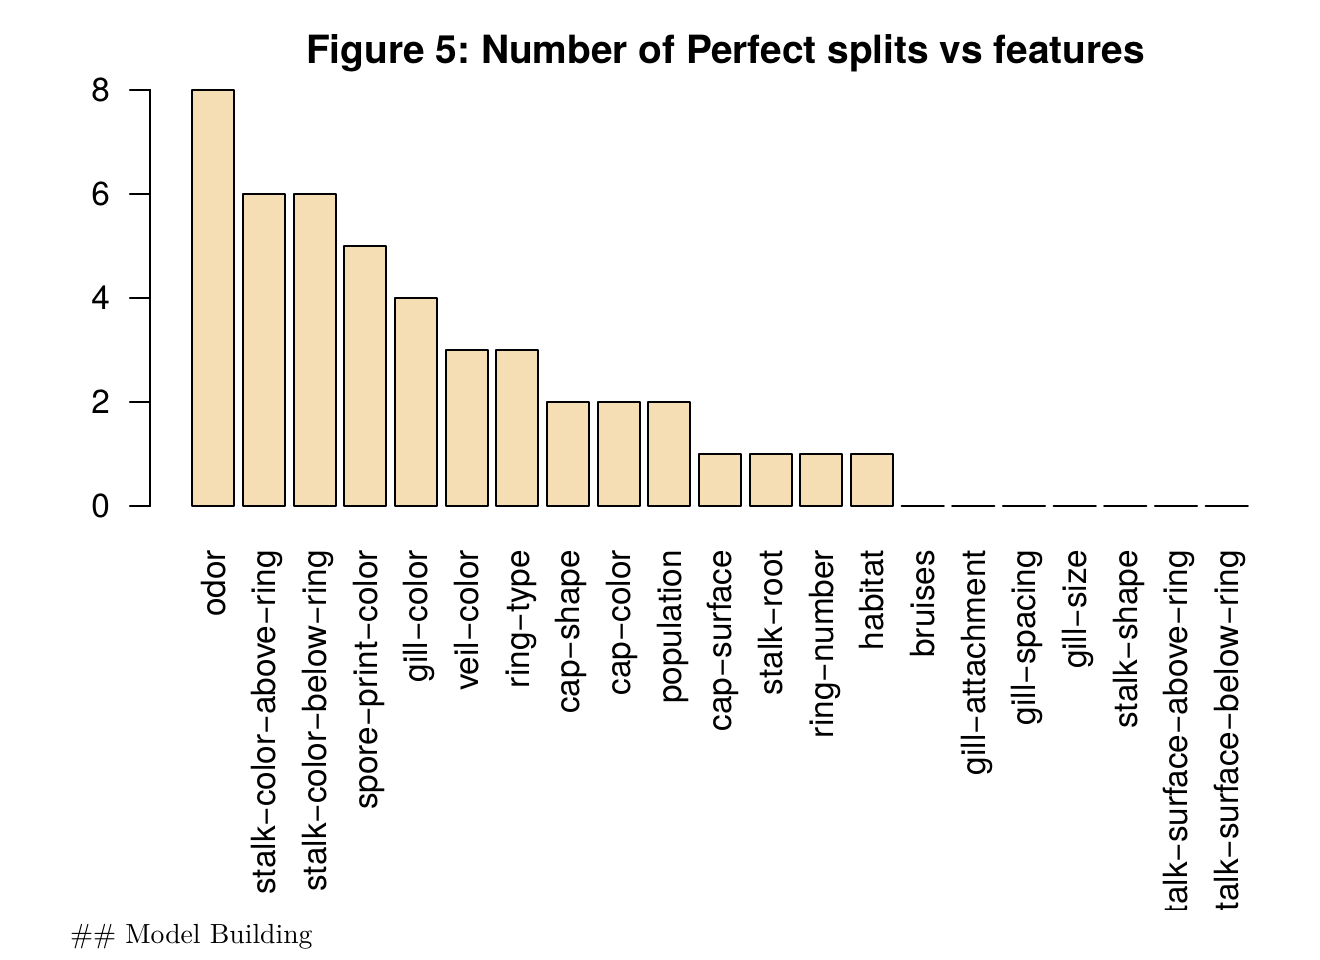
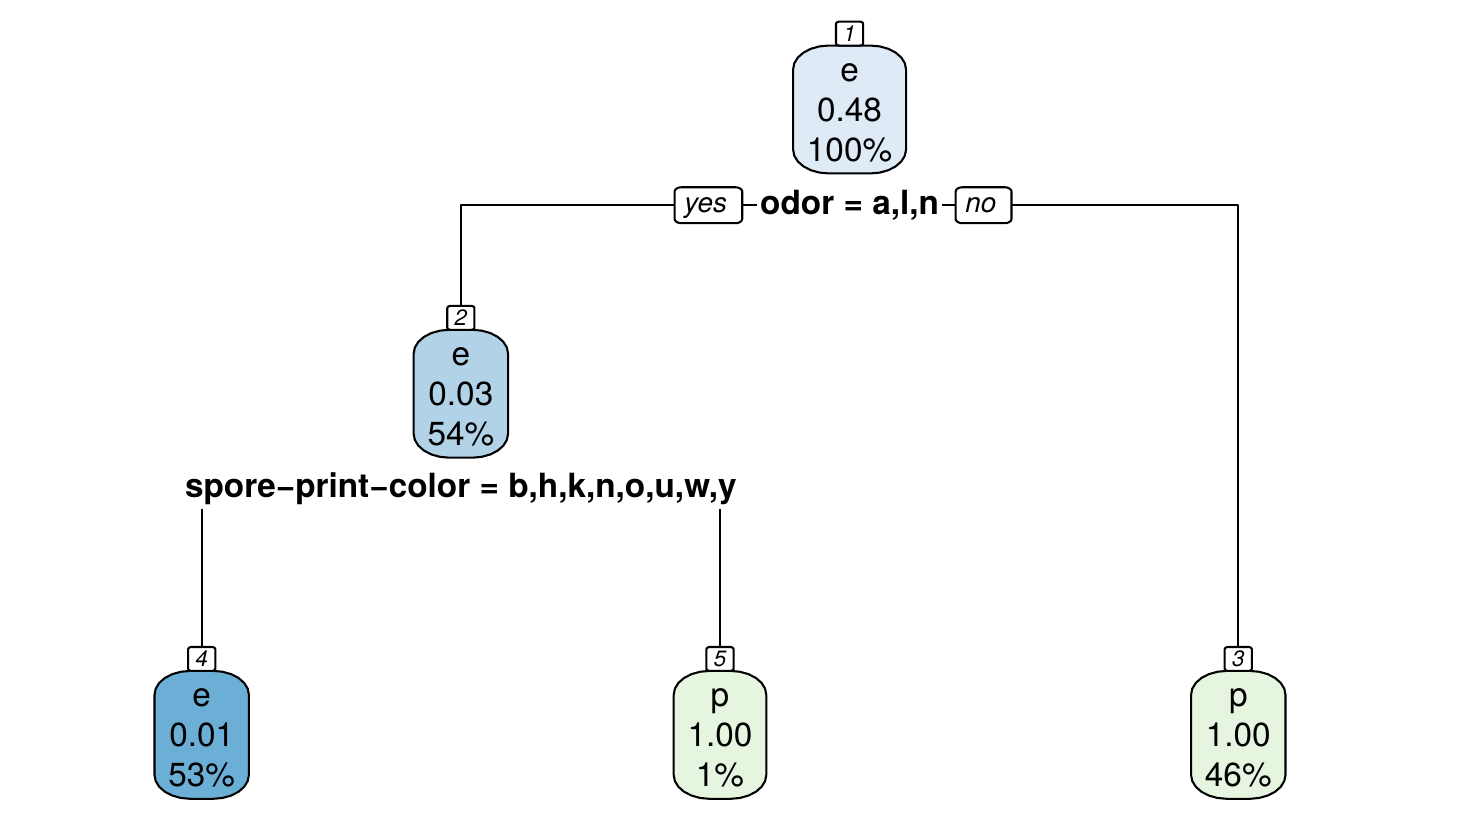
All three decision tree variants - a full tree, an optimized 60/40 split, and a pruned tree - landed between 99.32% and 99.48% accuracy, with 100% specificity across the board: not one poisonous mushroom was ever misclassified as edible in any model. The handful of errors all ran the safer direction, occasionally calling an edible mushroom poisonous rather than the reverse. With odor alone sorting roughly half the dataset perfectly, the practical takeaway is refreshingly simple: a foul or pungent odor is one of the most reliable, no-equipment-needed warning signs a forager or field guide can use.
Strategic Recommendations
- Publish odor as the headline field-safety rule in any consumer-facing guide or app - it's the single cheapest, most reliable, no-equipment check available, and it alone resolves over half of all cases correctly.
- Deploy the model as decision support, not a sole arbiter - pair it with human/expert verification given that misclassifications, while rare and safety-biased, are not zero.
- Collect spore-print-color data as a standard second check for the minority of specimens odor alone can't resolve, since it's the model's next-most-informative feature after odor.